Pivot Table widget
Pivot tables summarise large tables into a compact matrix — statuses across columns, offices down the rows, totals in the cells — so managers can scan exceptions without scrolling a thousand-row grid.
Typical scenarios:
- count of requests by status (columns) and department (rows);
- sum of amounts by month and product line;
- a fixed text label in a cell when you need a legend or marker instead of a number.
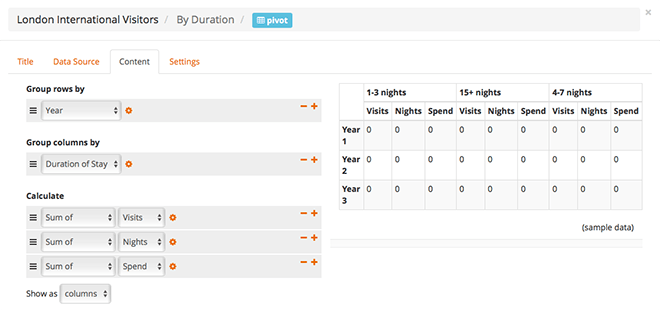
Rows, columns, and cells
| Setting | Purpose |
|---|---|
| Group rows by | Fields that define each row (multiple levels supported) |
| Group columns by | Fields that define each column (optional; otherwise a single column) |
| Calculations | What appears in each cell |
For each calculation:
| Option | Meaning |
|---|---|
| Record count | Number of matching records |
| Count distinct | Number of distinct values of a field |
| Sum / average / minimum / maximum | Aggregate a field (including text fields where that aggregation makes sense) |
| Fixed text | Show a constant label in the cell instead of a computed number |
Row and column groupings can sort by the group label or by a measure, and the first row grouping can use a top-N limit (keep only that many distinct values after sorting). Optional row totals and column totals add grand-total lines.
Row and column headings can be configured as links to other pages so operators can drill from the summary into the underlying list or detail.
Drill-through
Configure a drill-through destination for measure cells: clicking a cell opens a page with URL-seeded user filters for that cell’s row and column dimension values (equality filters). Date/time-formatted groupings are skipped because display buckets are not safe as equality filters. Optional popup opening is supported.
Date grouping
When a row or column group uses a date field, set Date format the same way as on charts (including Y and m/Y) so periods roll up cleanly.
Layout
Use widget Width and Visibility like other widgets when the pivot shares a dashboard with charts or grids.